Description
Runs smoothly even on the latest MT4 version. Instant download, limited time offer!
The highly requested legendary Holographic System is back!
Original price: $5,000 (!)
Original website: https://www.chartintelligence.com/
It is fully compatible with the new MT4 versions!!! Instant download!
The system is sold out on it’s original website and updates are sent to the private circle of Holographic customers. Currently BudgetForex Shop is the only place where you can buy the latest version of this high-end trading system for a low price.
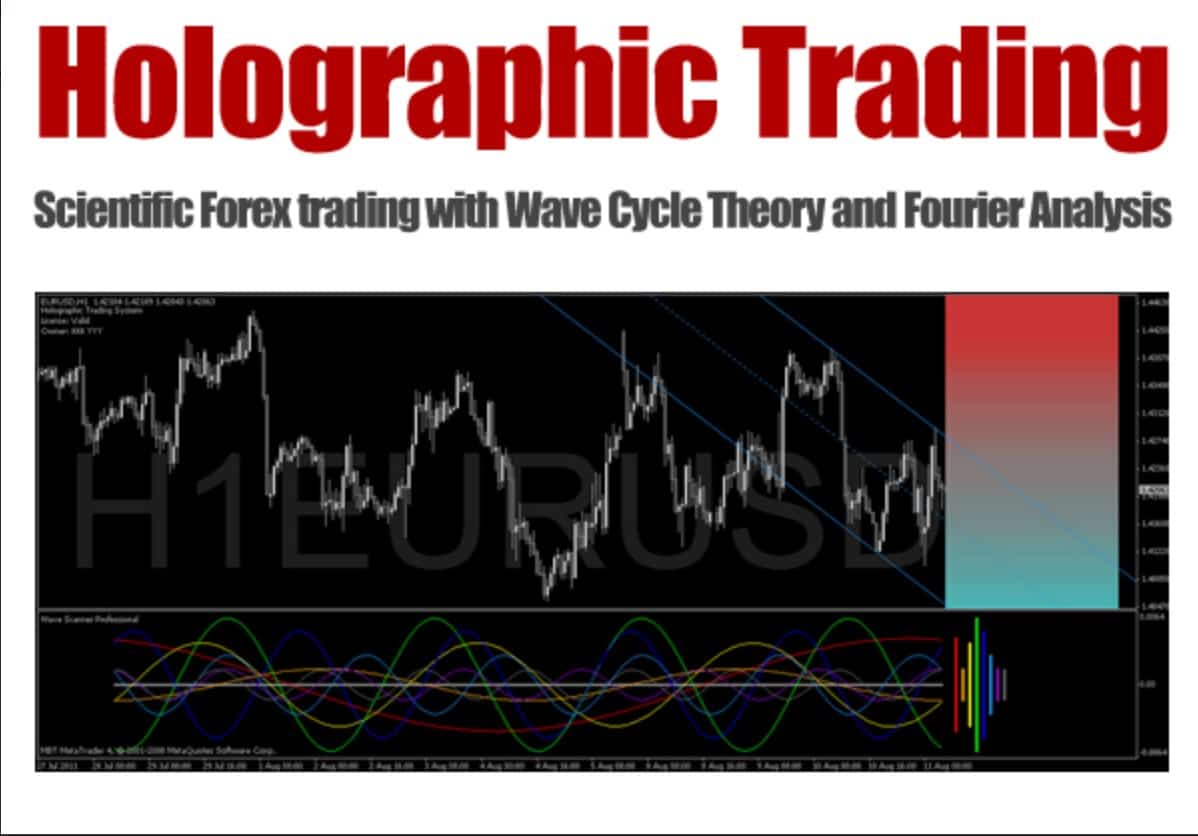
Holographic Trading System: Scientific Forex trading with Wave Cycle Theory and Fourier Analysis
The Holographic Trading System is a unique and high-level tool that uses the latest scientific resources
and was built by a group of mathematicians and physicists to help traders and investors in their trading decisions and analysis. The system itself is based on the Wave Cycle Theory and Fourier Analysis and can be used on the Forex, CFD-s and precious metals market.
What Does Wave Cycle Theory Mean?
Most of the phenomena we encounter in our daily lives occur in cycles. This is the case with seasons,the rising and setting of the sun,the ebb and flow, day and night, the Earth revolving around the Sun, etc. Today, we have accurate instruments to predict certain future events, which range from weather storms to collisions in space and the next tsunami or earthquake. The underlying factor in this forecasting is a series of repeated cycles on the basis of which we form our hypotheses. The same method is applied to market analysis. We can use market cycle theory to forecast the evolution of financial markets, i.e. we can predict when the low and high of a cycle will occur.
What Does Fourier Analysis Mean?
Named after the nineteenth-century French mathematician and physicist Joseph Fourier, the Fourier Analysis is a type of mathematical analysis that attempts to identify patterns or cycles in a time series data set which has already been normalised. By first removing any effects of trends or other complicating factors from the data set, the effects of periodic cycles or patterns can be identified more accurately, leaving the analyst with a good estimate of the direction that the data under analysis will take in the future.
The Parts of the Holographic System
The indicators of the Holographic Trading System are the next generation group of super indicators
because they not only give a multidimensional view of market activity but each indicator is based on sound scientific measurements rather than on anecdotal evidence and heuristics.
The indicators start with the measurement of the dominant cycle and are therefore adaptive to changing market conditions. There are a total of four indicators in the Holographic Trading system.
The main parts of the system:
1. Wave Scanner Professional
The Wave Scanner Professional is a holographic spectrometer. Our masterpiece indicator is the heart and soul of the Holographic Trading System. It is extremely easy to use this indicator as it breaks the main trend into different colorful and spectacular waves. Our Wave Scanner Professional uses the same technique as Mass Spectrometers:
it identifies a trend and with the built in spectrometric formula it separates the main trend into visible waves.
The trend is built up by these waves, or sub-trends and it is extremely easy to find entry and exit points after the wave separation. Of course our tool is not based on ions or atoms, but on mathematical formulas. But the conception is absolutely the same.
2. Heat Map Indicator
The purpose of this indicator is to highlight the price zones that had the most activity: the hottest zones.
The indicator shows a gradient of colors from cold to hot. The hot colors mean lots of activity and volume, the cold colors mean less or minimal activity and volume. This indicator gives the trader a deeper look into the market activity and it is useful as a map or key to see the current place of the price comparing to the whole picture.
3. Holographic SuppRes
It is a luxury automated support-resistance indicator. Drawing trend lines or support and resistance lines were mainly subjective… till now. With the Holographic SuppRes indicator drawing these lines is not a subjective work anymore but automated and objective, and also based on mathematical calculations. With it, the trader can see if the current trend is moving in a channel or not and also the possible turning points.
4. The Watermark
The Watermark helps traders to trade on different charts at the same time with showing the instrument name and timeframe with spectacular capital letters. It can be a big help for everyone who prefer to switch the charts quickly, even for short time traders.
Success Rate
We have analyzed 4200 occurrences of the holographic cycle turning points predicted by our system in the history of different instruments and have found that it has had an 85% success rate* at marking significant turning points**.
*85% success is reached on “average” trading days. No trading during August and December, no trading during bank holidays. Only the entry signals were involved into the test. The amount of correct entries were: 3572.
**significant turning point means at least 15 pips move in the predicted direction after the entry signal on the lower timeframes (5M, 15M, 30M, H1) and 75 pips move on the higher timeframes (H4, Daily).
Technical Specifications
– No need to have no prior knowledge about market cycles to take advantage of the system as all necessary knowledge can be studied from the user manual.
– The principle function of the system is to maximize our users’ gains and to minimize their potential losses.
– The system runs in Metatrader4 platform.
– The system can be used with all instruments on all timeframes.
– The system generates exact entry and exit signals and comes with complete SL/TP/Money Management rules.
– The installation is quick and easy, even for a novice trader.
Indicators:
1.Heat Map Indicator.ex4
2.Holographic SuppRes.ex4
3.Watermark.ex4
4.Wave Scanner Professional.ex4
Template :
#Holographic_System.tpl
Document:
Holographic System User Manual
Live account profit results example: